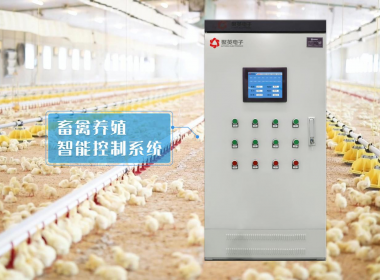
Case background:
China is a large country of facility agriculture. In recent years, facility agriculture has developed rapidly all over the country. Only Liaoning Province will have 10 million mu of facility agriculture this year. Jiangsu province uses "industrial thinking" to change the mode of agricultural development and industrial structure adjustment, It is proposed to "arm and transform agriculture with modern material conditions, modern science and technology and modern management methods. Although China is a large country of facility agriculture, it is not a powerful country of facility agriculture, and the automation and networking level of facility agriculture is not high. However, China's facility agriculture is showing the development trend of large-scale and collectivization, and a modern farm integrating production, processing, ecotourism, service and other functions has begun to appear.
System composition:
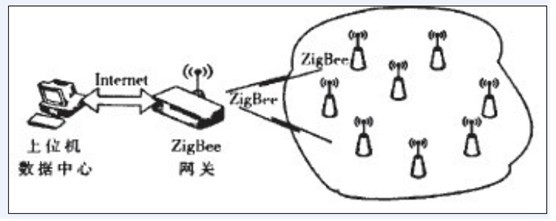
The system adopts the wireless data transmission terminal DTU based on ZigBee technology to collect the temperature, humidity, light and other parameters in the greenhouse, and send them to the ZigBee gateway for processing, and then upload them to the upper computer through the Internet. The upper computer sends the temperature, humidity, light and other control commands to the ZigBee terminal node through the gateway to control the corresponding equipment to adjust the relevant environmental parameters in the greenhouse, so as to realize the remote measurement and control of the greenhouse.
Overall framework:
As shown in Figure L, the greenhouse environment remote monitoring system of wireless sensor network is composed of wireless sensor measurement and control network terminal node, ZigBee gateway (Coordinator) and host computer data center. Each terminal node in wireless sensor measurement and control network is composed of a ZigBee communication module and a specific function sensor. Measure and control the temperature, humidity, light and other environmental parameters in the greenhouse, and each ZigBee terminal node (FFD) can also be wirelessly connected with multiple isolated sub nodes (RFDS) that do not undertake the task of network information transfer within the scope of its own signal coverage.
System hardware design
The hardware design of the whole system mainly includes ZigBee gateway (Coordinator), wireless measurement and control terminal GPRS RTU and wireless data transmission terminal DTU equipment.
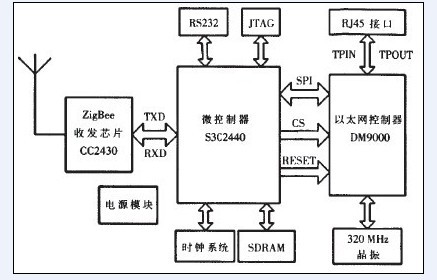
1. ZigBee gateway hardware architecture
The hardware architecture of ZigBee gateway (Coordinator) is shown in the figure. Its main function is to complete the conversion of data transmission format and remote data transmission, realize the communication connection between ZigBee network and Internet network, interact with remote server and manage ZigBee network.
2. Wireless measurement and control network terminal node
The schematic diagram of wireless measurement and control network terminal nodes is shown in Figure 3. Each terminal node takes CC2430 as the core and connects temperature, humidity, illumination sensors and related actuators through signal conditioning circuit.
The main application equipment is remote measurement and control terminal, and the model of RTU is jy-rtu6640.
3. System data transmission terminal
Adopt wireless data transmission terminal DTU
Model: jy-md
Industrial GSM / gprs modem jy-md is a dial-up Internet access device based on mobile GSM / GPRS network platform and embedded with industrial GSM / GPRS wireless module. The product is specially designed for the complex environment of industrial site through RS-232 or RS-485 interface Use a simple at command interaction interface, so that users face the at command interface based on serial communication, which can complete end-to-end reliable data communication.
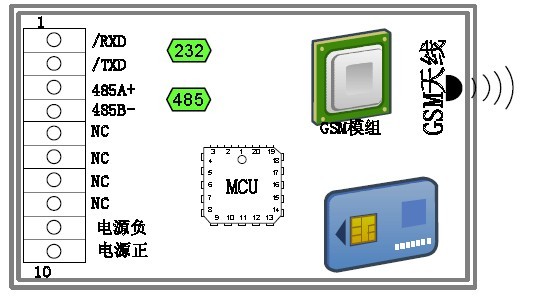
Functional structure diagram
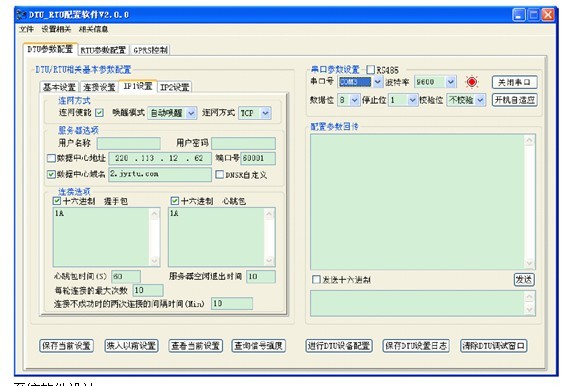
Configuration software
System software design
The whole measurement and control system software consists of ZigBee gateway software and wireless sensor measurement and control network terminal node software. Both parts need to transplant ZigBee protocol stack (Z-stack) to its ZigBee module, especially the implementation of PHY layer and MAC layer, which are closely related to the bottom of hardware. It provides API interface functions for upper communication applications.
1. Software design of ZigBee gateway
ZigBee gateway manages each terminal node of the wireless sensor measurement and control network downward and connects upward to realize the interaction function with the host computer data center. After initialization, ZigBee gateway first formats the network and selects the channel to establish a new network.
Software design of wireless sensor measurement and control network terminal node
The main work of the sensor terminal node is to collect data information, connect the network, undertake some routing functions, maintain communication with adjacent nodes, detect the link state, and transmit data through the wireless data transmission terminal DTU.
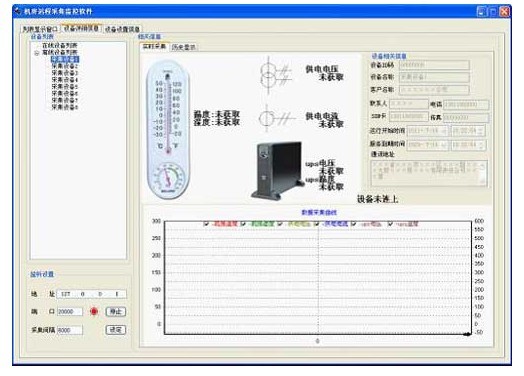
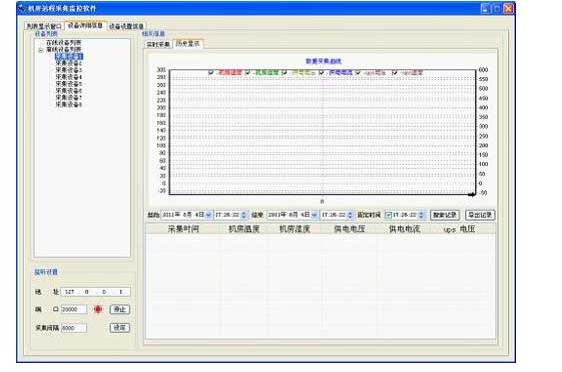
Monitoring software display
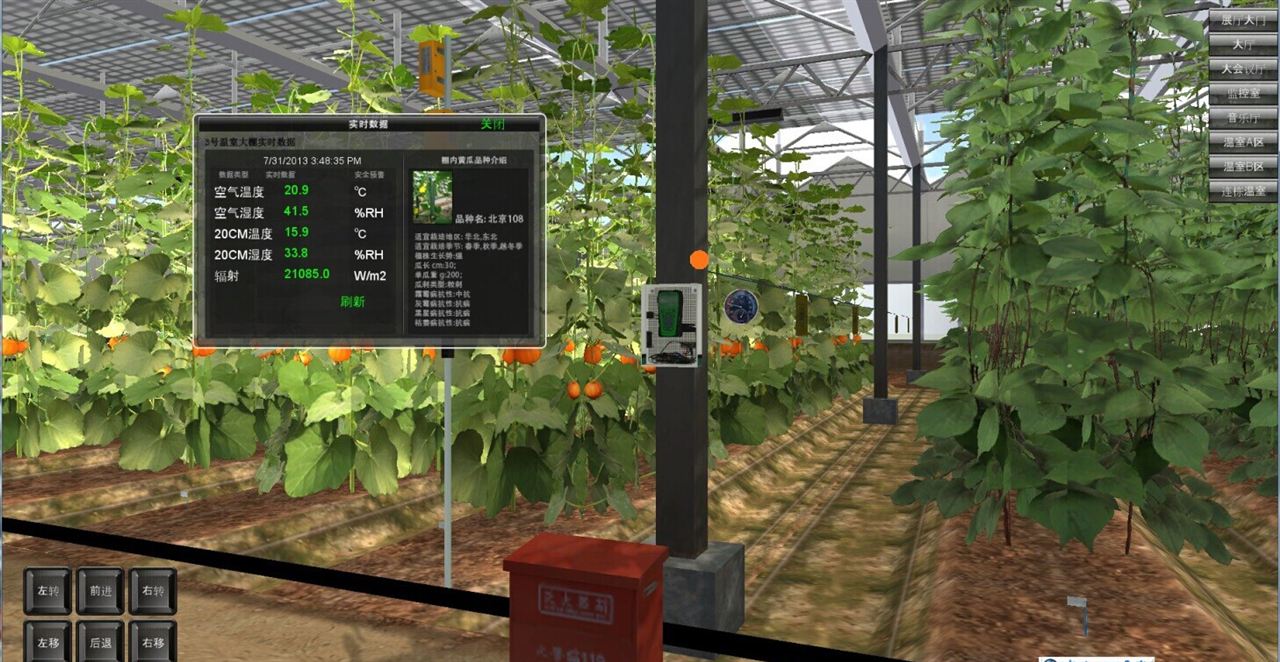
real-time display
1. The device list on the left shows the information of current online and offline devices. When the device is connected to the network, it will enter the "online device list" from the "offline device list". If the device is not online for a long time, it will enter the "offline device list" from the "online device list";
2. The upper right corner displays the equipment number, user name, contact person, operation date, system service expiration date, telephone, fax, mobile phone, address, SIM card number and other information;
3. The upper left corner shows the temperature and humidity in the greenhouse;
4. The temperature, humidity and other curves in the greenhouse are displayed in real time under the window;
5. The middle text prompts the current equipment login time and the last time of collecting and returning data;
Historical records
Users can search history according to time period;
The history record will be drawn on the window in the form of curve, and the history record can be displayed under the window in the form of list. Through the history record, the equipment operation status and relevant trend can be viewed;
The history records queried at the same time can be exported to excel;
Effect drawing of configuration software
Users can customize the program through configuration software according to their needs, so that the interface expression form is more flexible.
conclusion
In order to verify the dynamic change performance of system parameters, the corresponding sensors were artificially shielded, heated and humidified during the experiment. From the experimental results, these interferences were reflected in the monitoring interface of the upper computer in time. The current data change value is displayed in real time in the lower right corner of the monitoring interface. The experimental monitoring interface is shown in Figure 6, The jumping change of the display data curve just shows that the system has fast response speed and can collect the changes of environmental parameters in a very short time.
The system has good operation effect, low power consumption and strong mobility. The measured data can be uploaded to the host computer in real time for display and recording.


Email:service@juyingele.com
Tel:010-82899827/1 4006688400
Add:Block B,Jinyu Jiahua Building, Shangdi, Beijing 412
 Official Wechat
 Tmall shop
 JD shop